Both maps were telling the truth. Most smoke maps blend three kinds of data on one screen: readings measured at street level, smoke outlines traced from satellites, and forecasts built by computer models. Each answers a different question, and mixing them up is how a hazy sunset gets mistaken for a health alert, or the other way around. Here's something that might surprise you. The clues usually sit right on the screen, in the timestamp and the legend, and sometimes in a small time slider along the bottom. Spot them and you'll know whether you're reacting to the air you're breathing or to a prediction about it. A live wildfire smoke map NYC today search can lead you to real-time readings and smoke forecasts, making it easier to tell current conditions from predictions.
TL;DR Quick Answers
live wildfire smoke map NYC today
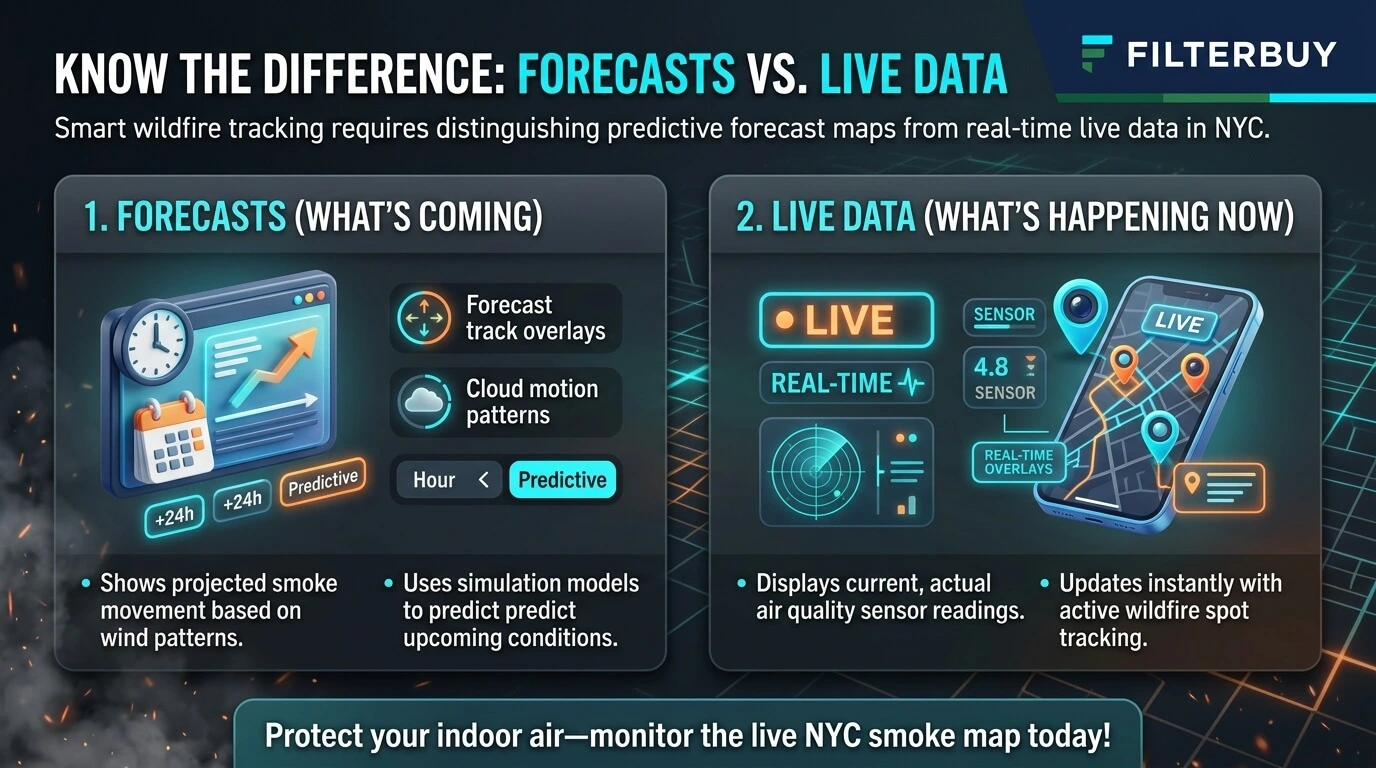
A live NYC smoke map shows what’s in the air right now, and most maps mix that with predictions. Trust the station dots with a “last updated” time inside the past hour and a NowCast AQI value. A time slider, a future “valid” time, or a model name like HRRR means you’re reading a forecast.
Live readings: Monitor and sensor dots measure PM2.5 at breathing height and update hourly.
Satellite smoke: Gray shading labeled light, medium, or heavy is observed, but it shows smoke overhead, which isn’t always smoke at street level.
Forecast layers: Play bars, “+6h” labels, and “vertically integrated” legends all signal a model run.
Indoor move: Once the nearest live reading passes AQI 100, close the windows, switch the fan to “On,” and run a MERV 8 filter.
Top Takeaways
One screen, three data types. Ground readings, satellite outlines, and model forecasts often share the same map.
Learn the tells. A slider or model name means forecast, while station dots, NowCast values, and a fresh timestamp mean observed.
Plumes show smoke overhead. Northeast smoke often stays aloft, so gray shading doesn't automatically mean bad air.
Cross-check before you act. Pair the nearest reading with the near-surface forecast and the state advisory.
Seal and filter indoors. Recirculate, run the fan, use MERV 8 filter where your system allows, and close up attic bypasses.
The Three Kinds of Data Behind One NYC Smoke Map
Most popular smoke maps stack several layers, so learn what each one is made of before trusting its colors.
Ground Monitor Readings: Observed, but Averaged
The colored dots and circles come from air monitors and sensors that measure fine particles, called PM2.5, at breathing height. They're as close to live as a smoke map gets. The catch is in how AirNow reports them. It uses a NowCast, a weighted average of up to the past 12 hourly readings, and it leans on the newest hours when smoke rolls in fast. Even so, the number can trail what you smell on the sidewalk. For a local gut check, the city health department posts hourly street-level readings beside an average of 11 state rooftop monitors.
Satellite Smoke Outlines: Observed, but Overhead
That gray shading marked light, medium, or heavy comes from NOAA's Hazard Mapping System. Trained analysts trace each outline by hand on satellite images. They work in daylight only and usually update heavy smoke about twice a day. So the outlines are genuine observations, yet they capture smoke anywhere in the sky above you, and an analyst can't tell whether it's drifting high overhead or settling onto your block. That's how a heavy plume over Manhattan ends up on top of green dots.
Model Smoke Forecasts: Predicted, Hour by Hour
Forecast maps come from weather models like NOAA's HRRR-Smoke and the newer RRFS, which use fire detections and wind to project where smoke goes next. HRRR-Smoke produces two very different layers. Near-surface smoke is what you breathe. Vertically integrated smoke adds up everything from the ground to about 16 miles high, so it can look alarming while street-level air stays fine. NOAA's forecast images for July 18, 2026 showed dense smoke across the Great Lakes and the Northeast, and the two models disagreed about how far it would spread. Treat any forecast as an educated estimate of where the smoke is headed. Wildfire smoke is one of the hazards to consider when looking at the most extreme weather in the U.S, especially in regions where shifting winds carry smoke far from active fires.
Five Signs Your NYC Smoke Map Is Showing a Forecast
Any one of these means you're looking at a prediction.
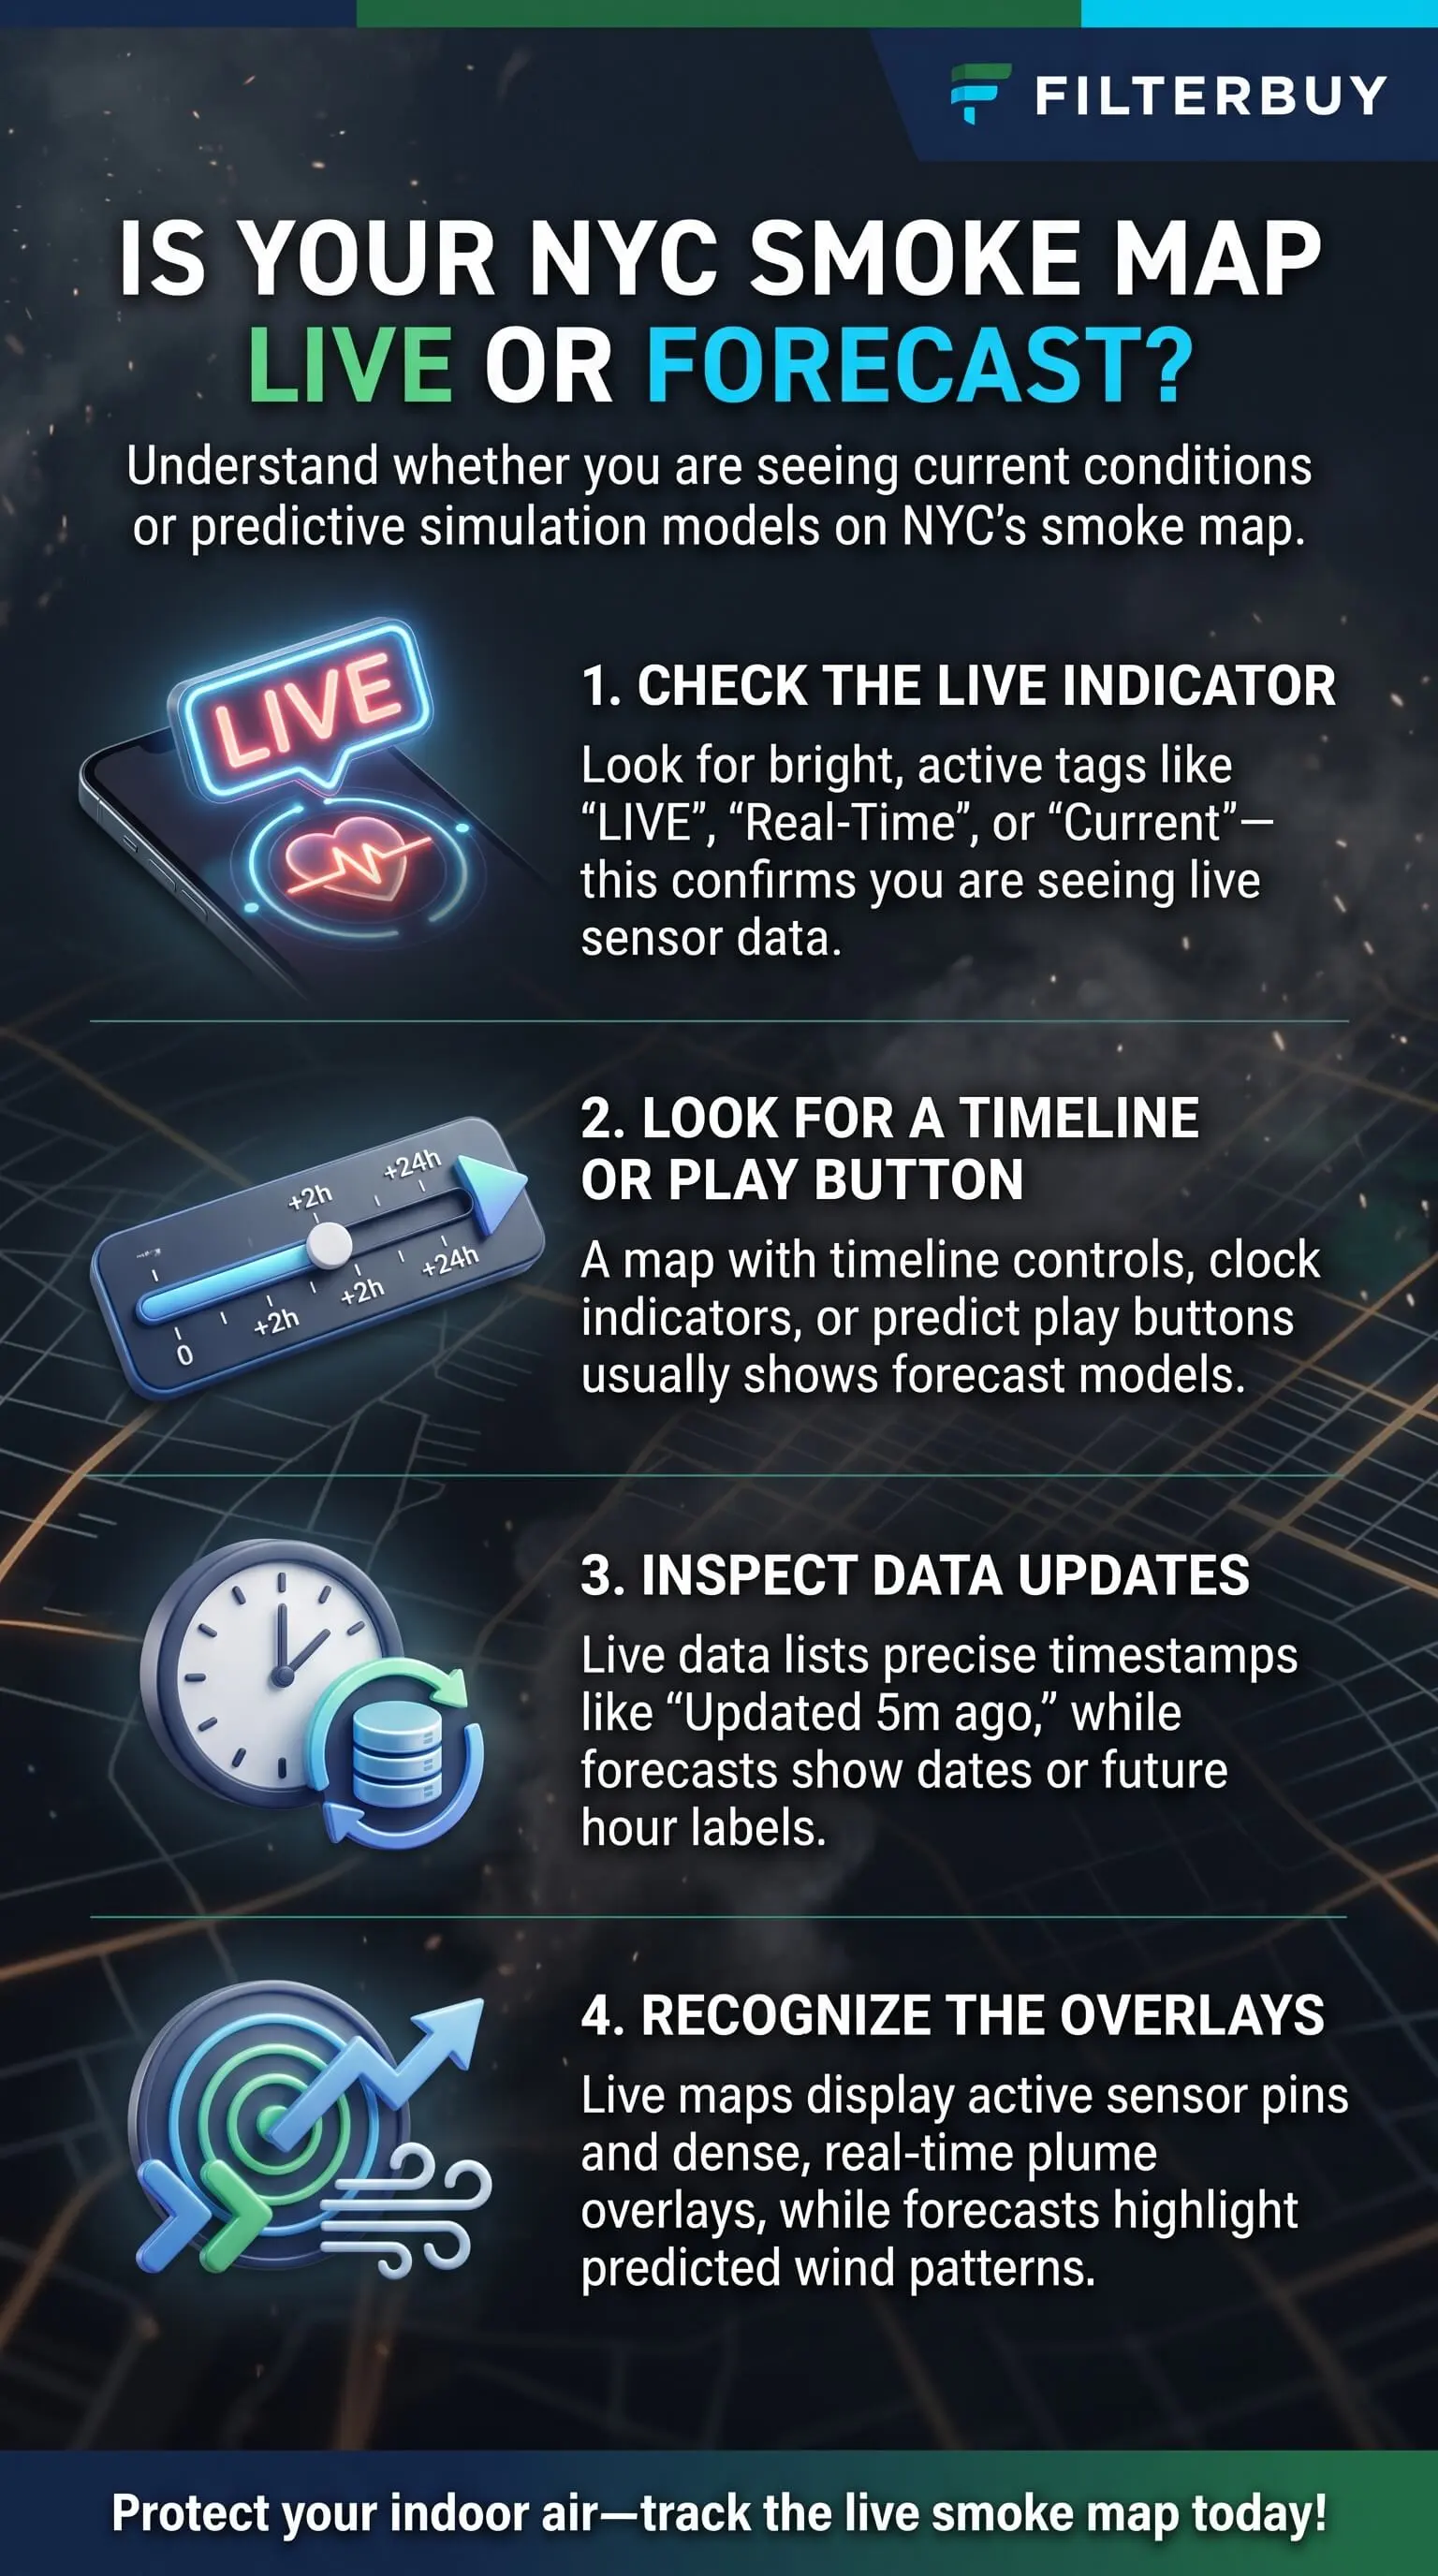
A play button or time slider. Anything you can scrub into later hours is a model run.
Labels like "valid," "forecast hour," or "+6h." They point to a future moment.
A model name. HRRR, RRFS, and CAMS are all forecast models.
Smooth color with no dots. A continuous wash with no stations comes from a model grid.
"Vertically integrated" in the legend. That layer totals the whole sky, not just street-level air.
Five Signs You're Looking at Live Observed Data
These mean someone or something actually measured the air.
Dots or circles pinned to fixed spots. Each one is a monitor or sensor.
A fresh "last updated" time. Anything within the past hour is what you want.
The word NowCast. It marks a current reading built from recent hours.
A dated satellite analysis. Plume layers carry a date plus a light, medium, or heavy label.
Agency credits. Live fire and smoke layers name their sources, such as NIFC or NOAA HMS.
Why the Map and Your Window Disagree
When the screen and the sky don't match, one of these gaps is usually behind it.
Smoke aloft. A wildfire burning in Quebec or Ontario can whiten the sky over the five boroughs long before its smoke mixes down to where you're standing. In the Northeast, a heavy plume often means a hazy sunset and breathable air.
NowCast lag. Because the reading averages recent hours, a sudden spike can take a few hours to show in full.
Forecast misses. A model might park the plume too far east, or bring it in hours early or late.
How I Cross-Check NYC Smoke Before Opening the Windows
My routine takes about two minutes, and I run it in this order.
Observed data first. I find the nearest monitor dot and check when it last updated.
The near-surface forecast next. I look 12 to 24 hours ahead and ignore the vertically integrated layer.
The state forecast last. New York State DEC posts its forecast and any health advisory.
When the nearest reading and the near-surface forecast agree, I act on them. When they don't, the ground reading wins for right now, and the forecast shapes my plans for the evening.
What Surface Smoke Means for the Air Inside Your Home
Don't take your indoor air for granted when the dots turn orange! Smoke that reaches street level finds its way indoors through the same gaps that leak your heating and cooling, like recessed lights, attic hatches, plumbing chases, and duct boots. An air ionizer can remove some airborne particles from the air, but choosing an ozone-free model is important to avoid introducing additional indoor air pollution.
Here's exactly what to do:
Shut windows and doors, and set your system to recirculate.
Flip the thermostat fan from "Auto" to "On" so air keeps moving through the filter.
Run a MERV 13 filter, or the highest rating your system can handle.
Put a portable HEPA air cleaner in the room your family uses most.
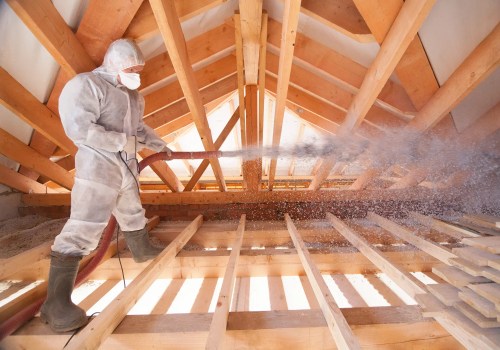
After smoke season, seal attic bypasses before you add insulation, because insulation slows heat but won't stop air leaks on its own.
Pro Tip: Let the observed reading drive indoor decisions and save the forecast for planning. Sensitive groups should cut back on time outside once the AQI hits 101, and at 151 that goes for everyone. Indoor air quality testing helps determine whether fine smoke particles have entered your home and whether additional air filtration is needed.
"In the attics I've worked in after smoke events, the gray streaking shows up first around recessed lights, the hatch, and duct boots. On hot, smoky days the AC's cool air sinks and leaks out low, so the house pulls replacement air in high through those exact gaps, which is why I tell homeowners to seal those bypasses before adding a single inch of insulation and shut down the smoke's easiest way in."
7 Essential Resources
Live Wildfire Smoke Map for NYC Today: Active fires, smoke outlines, and AQI for all five boroughs, plus indoor smoke steps.
NOAA Hazard Mapping System Fire and Smoke Product: Where the satellite plume outlines come from and what they can't show you.
NYS DEC Air Quality Index Forecast and Current Observations: The state AQI forecast, linked to real-time hourly readings.
CDC Wildfires and Your Safety: Smoke guidance for kids, older adults, and people with heart or lung conditions.
National Weather Service New York Office: Air Quality Alerts and forecasts for NYC, Long Island, and the lower Hudson Valley.
American Lung Association State of the Air: Yearly particle pollution grades, county by county.
National Interagency Fire Center Statistics: National wildland fire activity and season totals.
3 Supporting Statistics
An EPA working paper found that Midwest airports average about 56 days a year with a smoke plume overhead, yet only 4 days with smoke at the surface. EPA National Center for Environmental Economics
Researchers led by Tianjia Liu found that outside the western U.S. and Alaska, surface PM2.5 inside satellite smoke plumes stays low and barely shifts across density categories, a sign the smoke often stays aloft. Liu et al., International Journal of Wildland Fire, 2024
The NYC Health Department estimates long-term PM2.5 exposure contributes to about 2,000 excess deaths from lung and heart disease in the city each year, roughly 1 in 25. NYC Department of Health Real-Time Air Quality
Final Thoughts and Opinion
Here's my honest opinion. Smoke maps let people down far less often than our expectations of them do. Most of the confusion starts when someone treats a forecast like a reading, or a satellite outline like an air quality score. Sort the screen into what's measured, what's overhead, and what's predicted, and the map becomes a two-minute morning check instead of a guessing game. Then put your energy indoors, where it protects your family, with closed windows, a running fan, a filter that catches fine particles, and an attic that isn't quietly pulling smoke into your living space. That's where you get to be the hero of your household.
Frequently Asked Questions
Is the AirNow Fire and Smoke Map Live or a Forecast?
Mostly live. The dots show current NowCast readings and the plume layer shows the latest satellite analysis. Forecast pieces like Smoke Outlooks for specific fires sit on separate layers.
Why Does My Smoke Map Show Heavy Smoke Over NYC When the AQI Is Green?
The satellite plume picks up smoke anywhere overhead, so nearby green dots mean most of it is riding high. Keep checking as the day warms.
How Often Do NYC Smoke Maps Update?
Monitors report every hour. NOAA analysts usually redraw heavy smoke outlines about twice a day, and the forecast models rerun throughout the day.
How Accurate Are Wildfire Smoke Forecasts for New York City?
They handle broad timing and direction well but get shakier at the neighborhood level. NOAA is still testing its newer smoke models against real-world readings.
Which Map Should I Trust Before Going Outside Today?
Go with the nearest observed reading that has a recent timestamp, and use the forecast to plan the rest of your day.
Know Whether Your NYC Smoke Map Shows Forecasts or Live Data
Before you change your plans, check the timestamp and the legend and look for a time slider, so you know whether the map is measuring the air or predicting it. Then let the ground-level reading decide what happens inside your home, from closed windows to a running fan and a filter built for fine particles. Choosing high quality filters designed to capture fine smoke particles helps keep your indoor air cleaner when outdoor air quality worsens.